


| ||||||||
|
|
|
|
|
|
|||
|
The first science release, March 2013 (adapted from the ESO Messenger 151, 39) The VIMOS Public Extragalactic Redshift Survey (VIPERS) is an ongoing Large Programme to map in detail the large-scale distribution of galaxies at 0.5<z<1.2. With a combination of volume and sampling density that is unique for these redshifts, it focuses on measuring galaxy clustering and related cosmological quantities within the grand challenge of understanding the origin of cosmic acceleration. Moreover, VIPERS has been designed to also guarantee a broader legacy, allowing detailed investigations of the properties and evolutionary trends of z~1 galaxies. The survey strategy exploits the specific advantages of VIMOS, aiming at a final sample of nearly 100,000 galaxy redshifts to iAB=22.5, which represents the largest redshift survey ever performed with ESO telescopes. In this article we describe the survey construction, together with early results based on a first sample of 55,000 galaxies. INTRODUCTION There is no doubt that one of the major achievements of observational cosmology in the 20th century has been the detailed reconstruction of the large-scale structure of the Universe around us. Starting in the 1970s these studies developed into what nowadays is the industry of redshift surveys, beautifully exemplified by the ever-growing Sloan Digital Sky Survey project (SDSS, e.g. Eisenstein et al. 2011). Maps of the large-scale galaxy distribution have shown not only that the topology of large-scale structure is quite different from what it was imagined at the time of Edwin Hubble and Fritz Zwicky, but have also been crucial to quantitatively support the current, successful model of cosmology. The inhomogeneity we can measure in the galaxy distribution on different scales is in fact one of the most important relics of the initial conditions that shaped our Universe. The observed shape of the power spectrum P(k) of density fluctuations [or its Fourier transform, the correlation function ξ(r)], indicates that we live in a Universe in which only ~25% of the mass-energy density is provided by (mostly dark) matter. Combined with other observations, it also implies that a ubiquitous repulsive "dark energy" is required to provide the remaining ~75% and make sense of the overall picture. The peculiar motions of galaxies, which reflect the overall growth of structure driven by gravitational instability, also produce measurable effects on these clustering measurements. They give us a way to check whether the "dark energy" hypothesis is really correct, or rather that the observed acceleration is indicating a more radical possibility, i.e. that the theory of General Relativity (GR), describing the force of gravity, needs to be revised on large scales. Galaxy velocities affect the measured redshifts and produce what are known as Redshift Space Distortions (RSD) in the maps of large-scale structure (Kaiser 1987, Peacock et al. 2001) and, in turn, in the measured galaxy correlations. The observed anisotropy is proportional to the growth rate of cosmic structure f(z), which is a trademark of the gravity theory: if GR holds, we expect to measure a growth rate f(z)=[Ωm(z)]0.55 (Peebles 1980). RSD are now recognized to be a primary way to make this test (Guzzo et al. 2008). Directly probing the amplitude and anisotropy of clustering, redshift surveys promise to play a major role also in 21st century cosmology, at least as important as they did in the past one, as testified by several planned experiments and their importance to the forthcoming ESA Euclid mission (Laureijs et al. 2011). However, the yield of a redshift survey is much more than this. By building statistically complete samples of galaxies with measured luminosity, spectral properties and often colours and stellar masses, they are a key probe of galaxy formation and evolution and of the relationship between the baryonic component that we observe and the hosting dark-matter halos. A survey like the SDSS, for example, based on one million redshifts, has been able to measure to exquisite precision global galaxy population trends involving properties such as luminosities, stellar masses, colours and structural parameters (e.g. Kauffmann et al. 2003). In more recent years, deeper redshift surveys over areas of 1-2 square degrees focused on exploring how this detailed picture emerged from the distant past. Most of these efforts saw the VLT and the VIMOS spectrograph play a central role, specifically in the case of the VVDS (Le Fevre et al. 2005) and zCOSMOS (Lilly et al. 2009) surveys. The main goal of these projects was to trace galaxy evolution back to its earliest phases and/or understand its relationship with environment. Only the Wide extension of VVDS (Garilli et al. 2008), started to have sufficient volume to attempt cosmologically meaningful computations (Guzzo et al. 2008), yet with large error bars. At the end of past decade it became therefore clear to us that a new step in deep redshift surveys was needed, in the direction of building a sample at z~1 with volume and statistics comparable to those of the available surveys of the local Universe. VIPERS VIPERS was conceived to fill this gap by exploiting the unique capabilities of VIMOS. Started in Period 82, the survey will measure redshifts for ~ 105 galaxies at 0.5 < z < 1.2, covering an unprecedented volume. Its goals are to accurately and robustly measure galaxy clustering, the growth of structure and galaxy properties at an epoch when the Universe was about half its current age. The galaxy target sample is based on the excellent 5-band photometric data of the Canada-France-Hawaii Telescope Legacy Survey Wide catalogue [CFHTLS-Wide]. To achieve its goals, VIPERS is covering ~ 24 deg2 with a mosaic of 288 VIMOS pointings, split over two areas in the W1 and W4 CFHTLS fields (192 and 96, respectively). With a total exposure time of 45 min per VIMOS pointing, VIPERS will use a total of 372 hours of MOS observations, plus 68.5 hours of pre-imaging. Its area and depth correspond to a volume of 5 x 10⁷ h-3 Mpc3, similar to that of the 2dF Galaxy Redshift Survey at z~0 (Colless et al. 2001). Such combination of sampling and volume is unique among redshift surveys at z > 0.5. The target sample includes all galaxies with iAB < 22.5, limited to having z>0.5 through a robust ugri colour pre-selection. The use of an aggressive short-slit strategy (Scodeggio et al. 2009), allows the survey to achieve a sampling rate > 40%. The "Low-Resolution Red" grism (R=210), yields a spectral coverage between 5500 and 9500 A, for a typical redshift rms error of σz=0.00047 (1+z) (directly estimated from double measurements of 1215 galaxies). These and more details on the survey construction and the properties of the sample can be found in Guzzo et al. (2013).
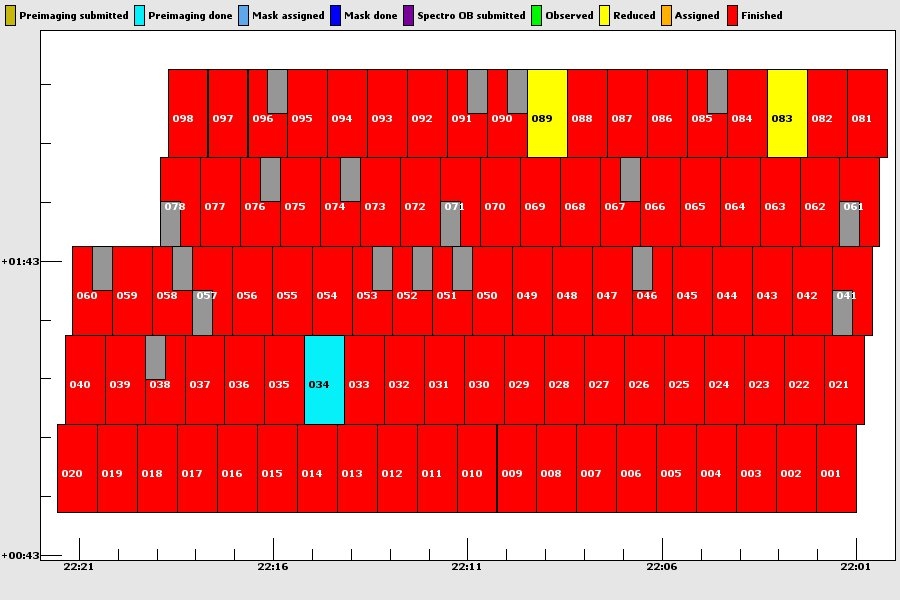
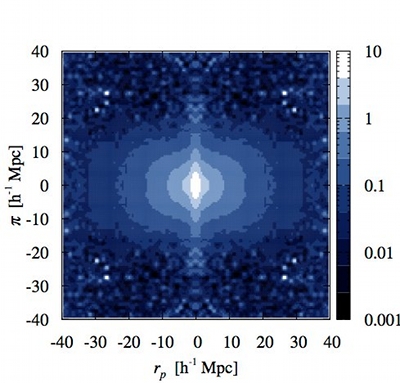
SURVEY AND DATA MANAGEMENT Handling a spectroscopic survey of this size requires making most of the typical operations automatic and reducing human intervention to the minimum necessary. Building upon the experience accumulated with previous surveys using VIMOS, a fully automated pipeline to process the observations from the raw frames to the final redshift measurement was set up at INAF - IASF in Milan. In this scheme, human work is limited only to the final verification and validation of the measurements, which is still necessary to recover about 20% of the correct redshifts for the lowest quality data. Most importantly, the whole management and book-keeping of the survey process was also organized within a web-based environment, named EasyLife (Garilli et al. 2012). This is a key feature of VIPERS, which allows us to know and keep under control in real time any past, present and future events concerning each one of the 288 VIMOS pointings that compose the VIPERS mosaic: pre-imaging, mask preparation, real-time atmospheric conditions during the MOS observations, quality of the spectra, names of the redshift reviewers, etc. This is all reachable through a point-and-click graphical interface, whose appearance is shown in Fig. 1. The two panels give the real-time status of each VIMOS pointing in the two W1 and W4 VIPERS fields. Similarly, the complete teamwork, from data validation to the science analyses, the distribution of results and draft papers, can be monitored and coordinated through related web pages. Finally validated redshifts and spectra are fed into an SQL-based database at the completion of the validation phase, such that the real-time survey catalogue (visible only to the data handling group) is constantly and automatically updated to the very last redshift measured. Internal releases can then be made by simply creating the snapshot of the catalogue at a given moment, assuring full version control on the catalogues used for science investigations (internally or publicly) at any stage of the project. A dedicated Wiki-Page system provides the team with the appropriate environment for science discussions and to share results. Public web pages are also available, to provide updates about the general project progress THE VIPERS PDR-1 CATALOGUE After processing, reduction and validation, the data observed until January 2012 yielded a catalogue of 55,358 redshifts, representing about 60% of the final expected sample. This catalogue, corresponding to the red areas in Fig. 1, has been frozen and is now called the Public Data Release 1 (PDR-1) catalogue. All data and analyses presented in the journal papers recently submitted for publication are based on this catalogue, which will become fully publicly next September. Here we present a selection of these recent results. UNVEILING THE STRUCTURE OF THE YOUNGER UNIVERSE The first immediate outcome of VIPERS is shown by the maps of the galaxy distribution in Figs. 2. The two cone diagrams present a remarkable combination of volume and dynamical range (in terms of scales sampled), which is a unique achievement of VIPERS at these redshifts. They allow us to appreciate both the details and the grand picture of large-structure, when the Universe was only between 5 and 8 billion years old. The following step is to quantify the observed structure as a function of scale. One of the main goals of VIPERS is the measurement of the amplitude and anisotropy of the galaxy two-point correlation function: a first estimate from the PDR-1 sample is shown in the two panels of Fig. 3. Crucial for these measurements is the accurate knowledge of several ancillary pieces of information on the survey, such as the photometric and spectroscopic angular selection masks, the target sampling rate and the spectroscopic success rate. These allow us to assign a weight to every observed galaxy in the survey, to correct for the overall incompleteness introduced by the different factors. The fingerprint of RSD is evident in the flattening of ξ(rp,π) along the line-of-sight direction (right panel). 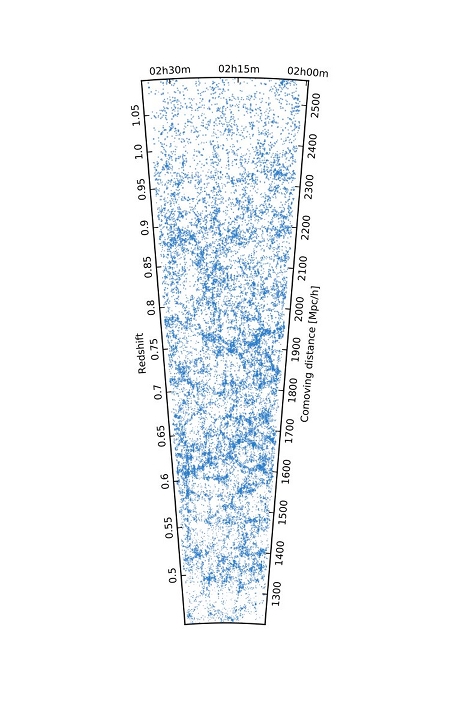 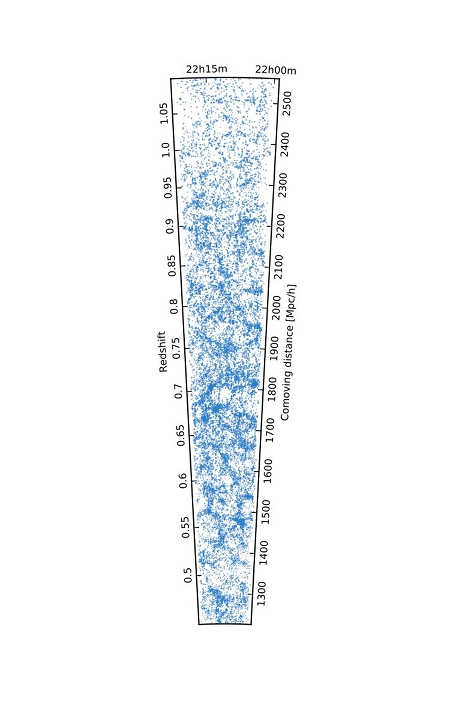
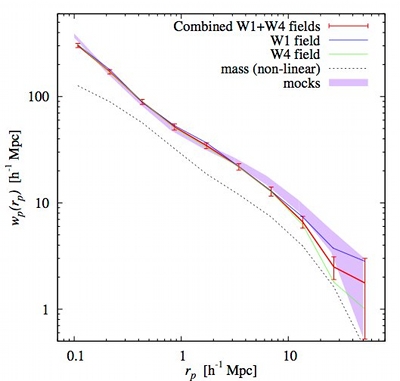
This anisotropy yields a first estimate of the mean growth rate of structure, which is presented in de la Torre et al. (2013). The measured value is in agreement with the predictions of General Relativity within the current uncertainty of ~15%. Comparison of the projected correlation functions wp(rp) (bottom panel) shows how well the measurements from the two independent fields agree, in both shape and amplitude. The final VIPERS catalogue will allow us to extend such measurement over two or more redshift bins. Statistical errors will also be reduced by measuring RSD with two independent galaxy populations (Mc Donald & Seljak 2009), an important specific advantage allowed by the high sampling of VIPERS.
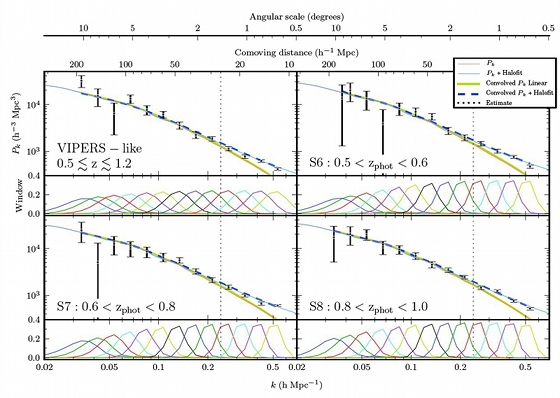
Fig. 4 shows another way of using the VIPERS data and quantifying galaxy clustering. The panels show different estimates of the power spectrum P(k) obtained from the de-projection of the angular clustering measured over the full photometric parent sample of VIPERS i.e. the ~140 deg2 of the CFHTLS (Granett et al. 2012). This has been made possible by knowledge of the galaxy redshift distribution provided by an earlier version of the VIPERS catalogue. This measurement of P(k) has been used to obtain improved constraints on the number of neutrino species and their total mass (Xia et al. 2012). A direct measurement of the 3D P(k) from the VIPERS redshift data alone is under development.
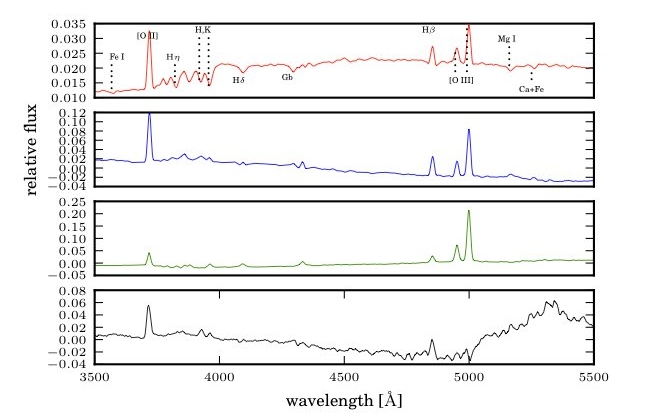
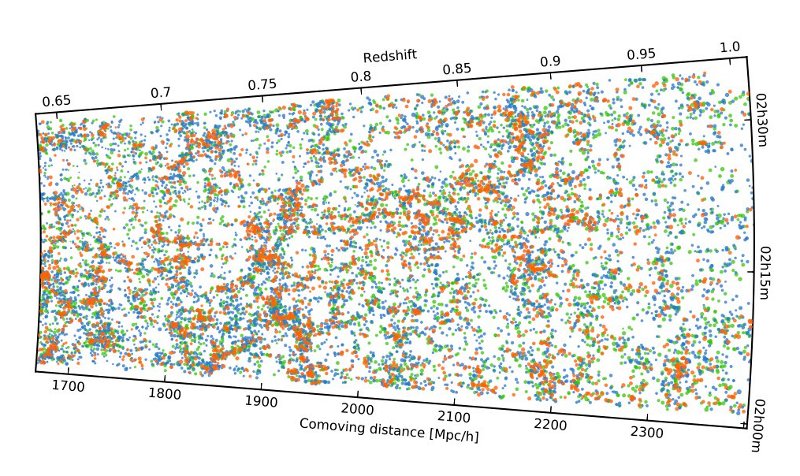
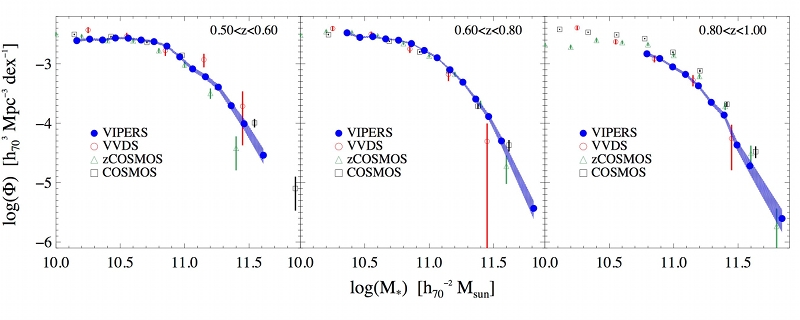
PINPOINTING THE PROPERTIES OF THE GALAXY POPULATION 7 BILLION YEARS AGO Fig. 5 refers instead to another recently published result, i.e. the decomposition of the first ~11,000 VIPERS spectra based upon Principle Component Analysis (PCA, Marchetti et al. 2013). The main goal here has been to develop an objective classification of galaxy spectra, capable of separating different populations in a robust way. This will have applications for studies in both galaxy evolution and cosmology (e.g. to define complementary large-scale structure tracers). The application of the PCA to the PDR-1 sample is undergoing. As in the case of other deep surveys, an important feature of VIPERS is the complementary photometric information over a wide wavelength range. For VIPERS, the five high-quality bands of the CFHTLS have been further enriched with UV (Galex) and near infrared K-band (WIRCAM) photometric observations. These measurements are combined to obtain for all VIPERS galaxies reliable Spectral Energy Distribution (SED) fits and, in turn, luminosities and stellar masses. Fig. 6 visually shows the unique power of combining large-scale (positions) and small-scale (here galaxy colours) information: the fact that the colour-density relation of galaxies is already in place at these redshifts is obvious from this figure. Such wealth of information can be quantitatively encapsulated by statistical measurements of the global population, to reveal overall evolutionary trends. One such statistics is the galaxy Stellar Mass Function, of which we show in Fig. 7 our estimate from the VIPERS PDR-1 catalogue (see Davidzon et al. 2013, for more plots and details). Given the volume of VIPERS, the one shown in Fig. 7 is without doubts the most precise estimate ever of the bright end of the mass function at z~1 (Davidzon et al. 2013), establishing a new reference for the mean density of massive galaxies at 0.5<z<1.2.
FURTHER RESULTS AND FUTURE PERSPECTIVES There are several other important results being obtained from the current VIPERS data. These include an estimate of the matter density parameter Ωm at z~0.8 (Bel et al. 2013), the luminosity dependence of clustering (Marulli et al. 2013) and the non-linearity of the galaxy biasing function (Di Porto et al. 2013), the evolution of the color-magnitude relation of galaxies (Fritz et al. 2013) and an automatic classification of stars, galaxies and AGN based on Support Vector Machines (SVM, Malek et al. 2013). The PDR-1 catalogue includes only ~60% of the final expected data. During the summer and fall of 2012, 31 additional pointings were observed, covering another full row in W1 (the purple and cyan fields in the top panel of Fig.1). These data are being processed and, based on the usual yield, are expected to deliver around 11,000 new redshifts. With the current pace, we expect spectroscopic observations at Paranal to be completed by 2014. We can foresee a number of exciting results being obtained from the VIPERS data in the coming years, with many that will originate from the general community, once the PDR-1 sample is in the public domain in September 2013. The grand view of large-scale structure in the ancient Universe provided by the first data we have discussed here, makes us hope that - as happened with previous redshifts surveys - the most exciting results will be those that were not even mentioned in the original proposal, but are there awaiting us, written inside the large-scale distribution of galaxies. We acknowledge constant support of the ESO staff for all operations in Garching and at Paranal. We especially thank our project support astronomer Michael Hilker, for enthusiastic contribution to all phases of the observation preparation and realization chain.
References
|
||
|
Webmaster: Paolo Franzetti - Web Design: Fabio Guzzo |